ITEMS RELATING TO
Registration
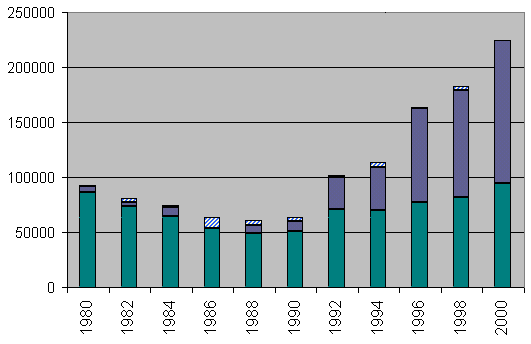
Column components from bottom to top represent California, other state actual reports, and other state estimates, respectively.
| 1980 | 1982 | 1984 | 1986 | 1988 | 1990 | 1992 | 1994 | 1996 | 1998 | 2000 | |
| AK | 600 | 900 | 1282 | 1000 | 900 | 800 | 700 | 600 | 500 | 3226 | 6884 |
| AZ | 2045 | 3406 | 3965 | 4400 | 4841 | 4632 | 4784 | 7574 | 18418 | 17466 | 12576 |
| CA | 86193 | 73442 | 64299 | 53267 | 49075 | 50782 | 71148 | 69951 | 77665 | 82079 | 94937 |
| CO | 576 | 753 | 1033 | 1258 | 1660 | 1945 | 2420 | 3201 | 4259 | ||
| CT | 29 | 50 | 70 | 149 | 682 | ||||||
| DE | 198 | 200 | 227 | 200 | 170 | 166 | 344 | 466 | 566 | 648 | 738 |
| FL | 650 | 700 | 850 | 1000 | 1336 | 1516 | 2909 | 3585 | 5509 | 7037 | 9462 |
| KS | 531 | 4204 | 5508 | 9829 | 9773 | 9976 | |||||
| LA | 175 | 190 | 219 | 230 | 260 | 290 | 325 | 360 | 500 | 691 | 1016 |
| MA | 204 | 333 | 8157 | 7610 | 16071 | ||||||
| MD | 328 | 350 | 2692 | 2700 | 3785 | 3800 | 4021 | ||||
| ME | 1048 | ||||||||||
| NC | 489 | 560 | 677 | 1472 | 2585 | 4754 | 6909 | ||||
| NE | 214 | 194 | 234 | 64 | 1790 | ||||||
| NH | 3637 | 3330 | 3207 | ||||||||
| NM | 123 | 150 | 190 | 300 | 450 | 600 | 800 | 1000 | 1407 | 1183 | 3787 |
| NV | 676 | 1003 | 673 | 692 | 739 | 1125 | 2315 | 2847 | 3833 | 4819 | 4715 |
| OK | 875 | 444 | 141 | 703 | |||||||
| OR | 500 | 750 | 1000 | 1400 | 1700 | 2000 | 3800 | 7000 | 10102 | 11946 | 13663 |
| PA | 4408 | 13770 | 23095 | 30248 | |||||||
| SD | 25 | 75 | 125 | 175 | 225 | 275 | 346 | 469 | 656 | 924 | 1074 |
| WV | 420 | 956 | |||||||||
| WY | 20 | 40 | 60 | 78 | 53 | 181 | 189 | 246 | |||
| 93091 | 80816 | 74760 | 63437 | 60769 | 64035 | 101894 | 113651 | 163535 | 183074 | 224713 | |
| 1980 | 1982 | 1984 | 1986 | 1988 | 1990 | 1992 | 1994 | 1996 | 1998 | 2000 |
Notes
- Registration figures are not strictly comparable from state to state because of differences among election laws and registration procedures. Some states do not have any registration by party, some have party registration but do not allow for Libertarian registration, and some allow it but do not consistently report the totals.
- Different states report registration totals on different schedules. Figures shown are the closest available to the general election in the even-numbered year.
- Figures shown in gray italics are estimates interpolated or extrapolated from actual counts, taking into account special circumstances such as changes in election law and major registration drives.
- Most historical figures were provided by Richard Winger. For further information about these figures and comparable figures for other parties, see Ballot Access News.
- For more details on particular states, see: